

















By Kevin P. Corbley
German researchers have conducted a massive study of global ocean conditions – known as the “sea state” – through analysis of Sentinel-1A/B satellites’ synthetic aperture radar (SAR) data collected over a 10-year period. While the study revealed modest changes, both positive and negative, in the sea state around the world, the results will serve as key baseline data sets for the European Space Agency’s ongoing Climate Change Initiative.
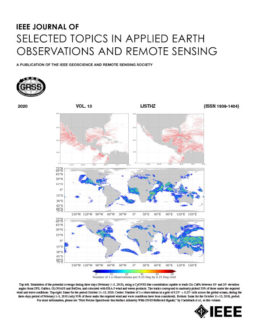
The research team led by the German Space Agency (DLR) published the results of its study in a recent issue of IEEE JSTARS to coincide with World Oceans Day 2026.
Sea state describes the condition of the surface of a water body related to its wave action, specifically the height, period, and spectrum of the waves. Many factors can influence the sea state including the wind, tides, and storms. Overall, changes in sea state are indicators of variations in the energy balance within the atmosphere.
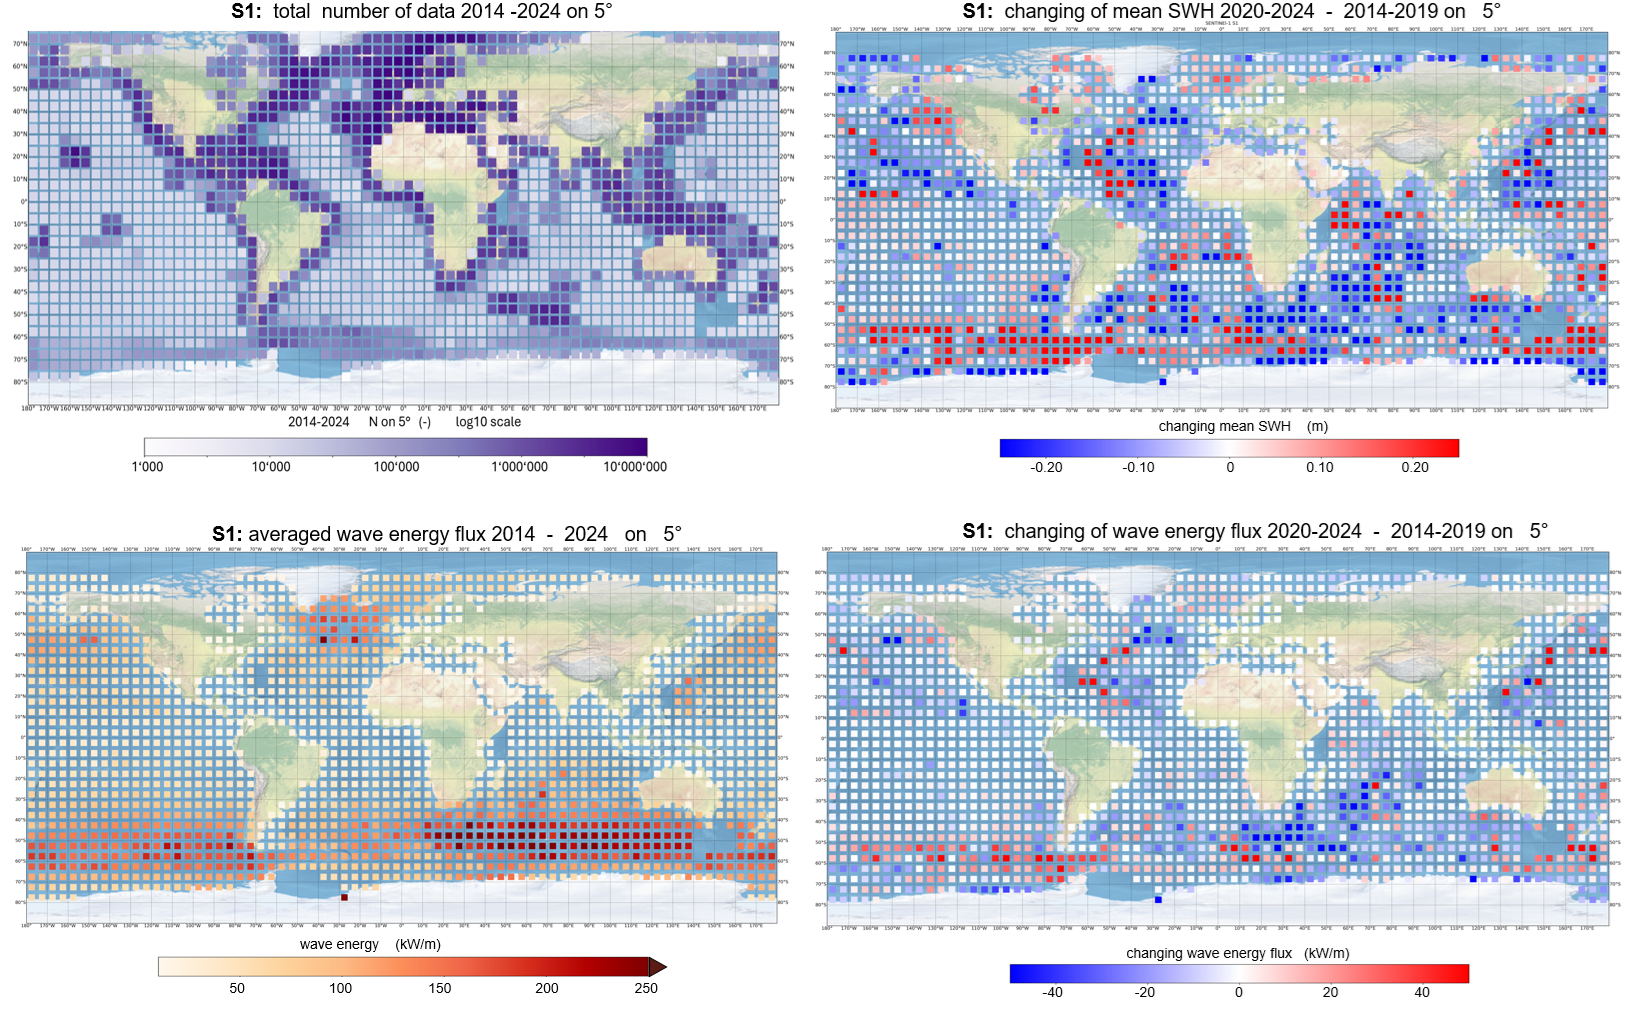
The goal of the German research was to measure the degree to which wave conditions have changed worldwide during the period in which Sentinel-1A/B captured imagery from 2014 to 2024 with their C-band radar sensors.
SAR satellite data was considered nearly ideal for the project because radar images can cover extremely large geographic areas while still measuring the height and spatial distribution of surface waves quite accurately is based on newest methods. These use machine learning approaches applied to large worldwide archives of satellite acquisitions, hindcast and in-situ measurements. Additionally, SAR sensors operate in light or darkness and capture data through clouds, providing insights during stormy conditions. The challenge, of course, was the enormous size of the SAR data: a single day of Sentinel-1 SAR data amounts approximately 1000 worldwide acquisitions with ca. 1.5 TB; whole archive amounts more than 6 petabytes. However, the use of the newest supercomputers made it possible to overcome this challenge.
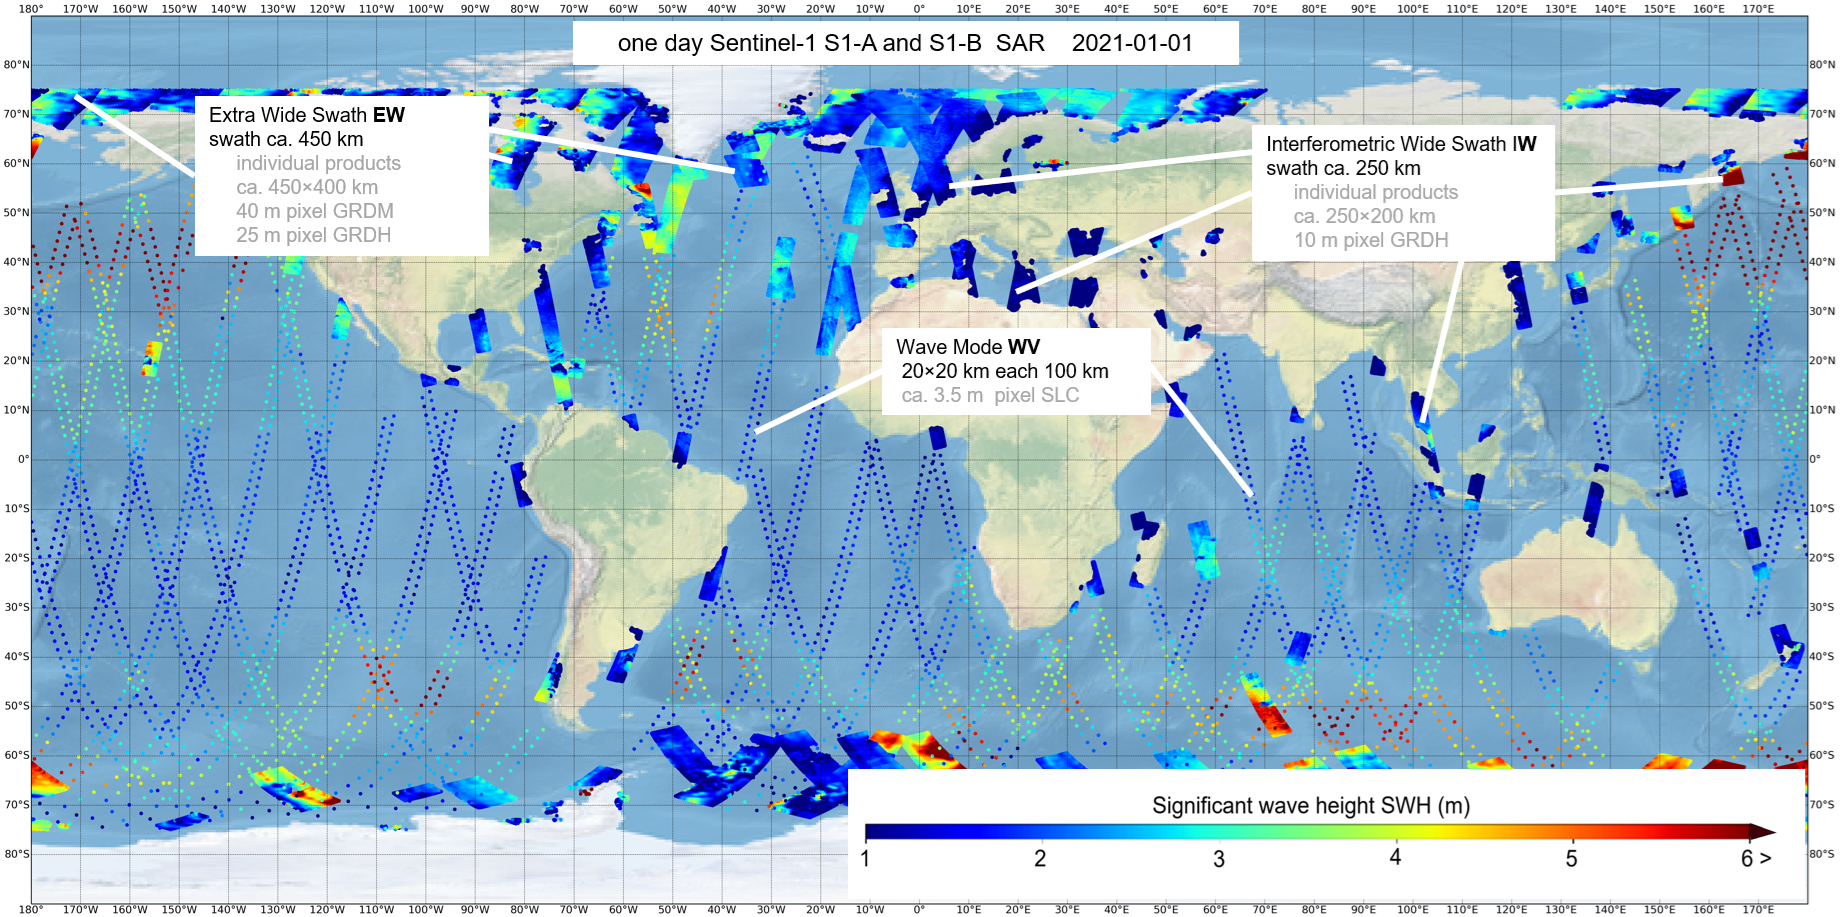
The Sentinel-1 satellites operate in multiple imaging modes. The researchers chose to analyze different mode data sets for various parts of the Earth – Wave Mode (WV) over open oceans, Interferometric Wide (IW) Swath in shelfs and seas, and Extra Wide (EW) Swath mode in polar regions. For the study, all available Sentinel acquisitions covering the entire globe were processed (approximately 4.2 million) with ca. 2 million scenes cover oceans and seas.
The researchers developed and utilized an empirical algorithm SAR-SeaStaR (SAR Sea State Retrieval), which uses machine learning to measure wave conditions in radar image data. An advantage of this empirical approach is that it enables processing the sea state parameters from all acquisitions, regardless of whether the sea state appears in the SAR scenes as wave structures or merely as noise. It could be modified to accommodate data sets of the different SAR modes and other SAR satellites.
In the study, the algorithm was improved by extension the training and validation datasets with collected worldwide storm observations and numerous buoy collocations. A half million buoy data points contributed significantly to the quality of the analysis.
A crucial part of the algorithm is the denoising, filtering, and correction of NRCS artifacts ranging from very high values (ships, buoys, windfarms, etc.) to low NRCS (wind shadow, slicks, current fronts) as well as processing errors.
Using the linear regression techniques as a first-guess solution, the algorithm applies the Support Vector Machine method complemented by high-performance ThunderSVM libraries for faster data processing. At its core, SAR-SeaStaR estimates wave parameters directly from the intensity of the SAR images by extracting 54 primary features, divided into five categories:
- Normalized Radar Cross Sections (NRCS) statistics (e.g. variance, skewness, etc.)
- Geophysical Parameters (wind from NRCS using CMOD approaches)
- Gray Level Co-Occurrence Matrix Parameters (e.g. homogeneity, dissimilarity, etc.)
- Spectral parameters based on image spectrum integration for different wavelength domains (0–30 m, 30–100 m, 100–400 m, etc.)
- Spectral parameters using products of normalized image spectrum with orthonormal functions (CWAVE approach) and cutoff.
By refining the training data and leveraging the SVM methodology, this machine learning approach ultimately achieved a highly accurate worldwide significant wave height (SWH) root mean square error RMSE of 0.25 m for WV, 0.38 m for IW acquisitions and 0.45 m for EW acquisitions. This is based on validation of all existing scenes inside of ice-free area (-55°<LAT<60°) with approx. 3% of non-valid data (means processing all scenes, but a part within a scene can be rejected as “non-valid”).
Overall, the analysis of all processed data points to a slight global increase in the percentage of low-status state, a slight decrease in high sea state, and 2 percent increase in storm intensity. Variations were also observed in geographic regions over the 10-year period. Storm intensity increased in the northern North Atlantic Ocean while decreasing in its central part. Africa’s Cape of Good Hope storms lessened in energy, and Cape Horn in South America saw more intense storms.
The sea state data has been delivered to the ESA Climate database where it is being analyzed with data from other types of ocean condition measurements. The German research team hopes to extend the results of the study by including SAR data from pre-Sentinel-1 missions. Looking further into the future, the team concludes that sea state data will likely be captured and transmitted to ground stations in near real time using analysis algorithms onboard Earth observation satellites.
Please read the entire JSTARS paper here: