


With rapid advances in small Synthetic Aperture Radar (SAR) satellite technology, Earth Observation (EO) now provides submeter-resolution all-weather mapping with increasing temporal resolution. While optical data offer intuitive visuals and fine detail, but are limited by weather and lighting conditions. In contrast, SAR can penetrate cloud cover and provide consistent imagery in adverse weather and nighttime, enabling frequent monitoring of critical areas—valuable when disasters occur or environments rapidly change. Effectively exploiting the complementary properties of SAR and optical data to solve complex remote sensing image analysis problems remains a significant technical challenge.
The 2025 IEEE GRSS Data Fusion Contest, organized by the Image Analysis and Data Fusion Technical Committee, the University of Tokyo, RIKEN, and ETH Zurich aims to foster the development of innovative solutions for all-weather land-cover and building damage mapping using multimodal SAR and optical EO data at submeter resolution. The contest comprises two tracks focusing on land cover types and building damage, respectively, and presents two main technical challenges: effective integration of multimodal data and handling of noisy labels.
Track 1: All-Weather Land Cover Mapping
Track 1 focuses on developing methods for land cover mapping in all weather conditions using SAR data. The training data consists of multimodal submeter-resolution optical and SAR images with 8-class land cover labels. These labels are pseudo-labels derived from optical images based on pre-trained models. During the evaluation phase, models will rely exclusively on SAR to ensure they perform well in real-world, all-weather scenarios. It aims to improve the accuracy of land cover mapping under varying environmental conditions, demonstrating the utility of SAR data in monitoring land cover. The performance will be evaluated using the mean intersection over union (mIoU) metric.
Track 2: All-Weather Building Damage Mapping
Track 2 aims to develop methods for assessing building damage using bi-temporal multimodal images. The training data contain optical images from before the disaster and SAR images after the disaster, all at submeter resolution, labeled with four classes: background, intact, damaged, and destroyed buildings. Mapping building damage from multimodal image pairs presents unique challenges due to the different characteristics of optical and SAR imagery. During the evaluation phase, models will be applied to pre-disaster optical and post-disaster SAR image pairs to produce accurate assessments of building damage, showing the extent and severity of building damage, which are essential for effective disaster response and recovery planning. The performance will be evaluated using the mIoU metric.
Scientific papers describing the best entries will be included in the Technical Program of IGARSS 2025, presented in an invited session “IEEE GRSS Data Fusion Contest,” and published in the IGARSS 2025 Proceedings.
Competition Phases
The contest in both tracks will consist of two phases:
- Phase 1 (Development phase): Participants are provided with training data and additional validation images (without any corresponding reference data) to train and validate their algorithms. Participants can submit prediction results for the validation set to the Codalab competition websites to get feedback on their performance. The performance of the best submission from each account will be displayed on the leaderboard. In parallel, participants submit a short description of the approach used to be eligible to enter Phase 2.
- Phase 2 (Test phase): Participants receive the test data set (without the corresponding reference data) and submit their results within five days from the release of the test data set. After evaluation of the results, four winners from the two tracks are announced. Following this, they will have one month to write their manuscript, which will be included in the IGARSS proceedings. Manuscripts are 4-page IEEE-style formatted. Each manuscript describes the addressed problem, the proposed method, and the experimental results.
Calendar
Phase 1
- January 13
Contest opening: release of training and validation data
The evaluation server begins accepting submissions for the validation set. - February 28
Participants submit a short description of their approach in 1-2 pages (using the IGARSS paper template)
Phase 2
- March 3
Release of test data; evaluation server begins accepting test submissions - March 7
Evaluation server stops accepting submissions
Winner announcement and publications
- March 21
Winner announcement - April 18
Internal deadline for papers, DFC Committee review process - May 12
Submission deadline of final papers to be published in the IGARSS 2025 proceedings - August
Presentation at IADF-dedicated IGARSS 2025 Community-Contributed Sessions
The Data
Track 1
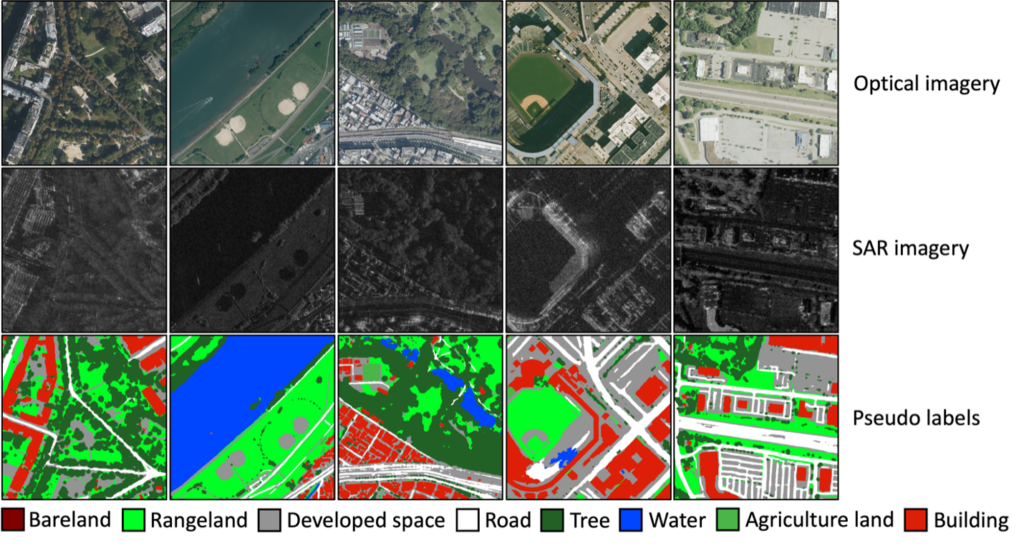
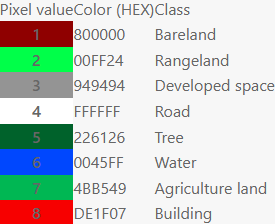
In Track 1, we provide a multimodal dataset of optical and SAR images, consisting of approximately 4300 aerial RGB and SAR image pairs with 8-class land cover pseudo-labels. The 8 classes include bareland, rangeland, developed space, road, tree, water, agriculture land, and building. The pseudo labels are generated from pre-trained OpenEarthMap models. The images cover 35 regions in Japan, USA, and France, with a ground sampling distance (GSD) between 0.15-0.5 meters. Both the images and labels are provided in TIFF format. For training, paired optical and SAR images with pseudo labels are available. For validation and testing, only SAR images are provided for metric evaluation.
- Aerial RGB images: Aerial images are from the National Agriculture Imagery Program (NAIP), the French National Institute of Geographic and Forest Information (IGN), and the Geospatial Information Authority of Japan (GSI). Each aerial image is available as an 8-bit RGB TIFF tile, with a standard tile size of 1,024 × 1,024 pixels to match the SAR resolution.
- Umbra SAR images: The SAR images are all provided by Umbra. These SAR images are provided as 8-bit single-channel TIFF tiles, with a pixel spacing ranging of 0.15 to 0.5 meters per pixel and a title size of 1,024 × 1,024 pixels.
- Land cover labels: Pseudo land cover labels for training are generated using pre-trained OpenEarthMap models. For testing, selected areas within urban regions are manually labeled by experts to provide high-quality evaluation data.
Track 2
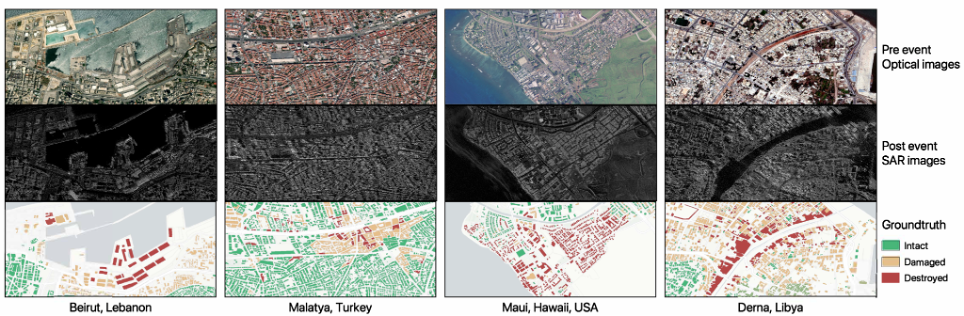
In Track 2, we provide the following multimodal VHR dataset (called BRIGHT). This dataset encompasses eleven disaster events across the globe, covering six types of disasters: earthquakes, wildfires, volcanic eruptions, floods, storms, and explosions. Approximately 3,000 multimodal image pairs are available, each consisting of a pre-disaster optical image and a post-disaster SAR image, accompanied by building damage labels. The dataset provides labels for four classes: background, intact buildings, damaged buildings, and destroyed buildings. All images have a ground sampling distance (GSD) of 0.3 to 1 meter per pixel, and both images and labels are in TIFF format. In this Track, nine of the eleven disaster events are designated as training and validation data, while the remaining two serve as test data. This setup allows us to assess model generalization on unseen disaster events.
- Pre-disaster optical images: These images primarily originate from the MAXAR Open Data Program, the National Agriculture Imagery Program (NAIP), NOAA Digital Coast Raster Datasets, and the National Plan for Aerial Orthophotography Spain. Each optical image is provided as an 8-bit RGB TIFF tile with a resolution range of 0.3–1 meter per pixel and a standard tile size of 1,024 × 1,024 pixels.
- Post-disaster SAR images: The post-disaster SAR images are mainly sourced from the Capella Space Open Data Gallery, with a few images from the Umbra Space Open Data Program. These SAR images are provided as 8-bit single-channel TIFF tiles, matching the optical images’ 1,024 × 1,024 pixels’ dimensions and resolutions.
- Building labels: Expert annotators manually labeled buildings, and all labels underwent independent visual inspection to ensure accuracy.
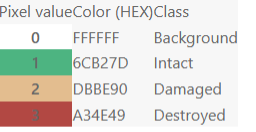
- Building damage information: Building damage information was obtained from the Copernicus Emergency Management Service and UNOSAT’s Emergency Mapping Service. The specific label values represent the meanings: 0 for background, 1 for intact building, 2 for damaged building, and 3 for destroyed building.
Submission and Evaluation
Participants will submit land cover maps and building damage maps to the Codalab server for Tracks 1 and 2, respectively.
Track 1: codalab.lisn.upsaclay.fr/competitions/21121
Track 2: codalab.lisn.upsaclay.fr/competitions/21122
All maps shall be a png gridded raster product. Each map will have the same grid and resolution as the identified test data file.
Classification accuracy will be evaluated against the reference data of the test set, which will not be provided to participants. The mIoU metric will be used to rank the results. The algorithm with the highest mIoU on the Phase 2 test set will be the winner.
Baseline
A baseline that shows how to use the DFC25 data to train models, make submissions, etc., is provided below for both the tracks.
Track 1: github.com/cliffbb/DFC2025-OEM-SAR-Baseline
Track 2: github.com/ChenHongruixuan/BRIGHT
Results, Awards, and Prizes
The first and second-ranked teams in both tracks will be recognized as winners. To be eligible for the prize, teams must contribute to the community by sharing their code openly, such as on GitHub. The winning teams will:
- Present their approaches in a dedicated DFC25 session at IGARSS 2025
- Publish their manuscripts in the Proceedings of IGARSS 2025
- Receive IEEE Certificates of Recognition
- Be awarded during IGARSS 2025, Brisbane, Australia in August 2025
- Be awarded travel support of up to $4,500 USD per team to attend IGARSS 2025 (*subject to adjustment based on currency exchange rates).
- Co-author a journal paper summarizing the DFC25 outcomes, which will be submitted with open access to IEEE JSTARS.
The costs for open-access publication will be supported by the GRSS. The winning team prize is sponsored by Mitsubishi Electric Corporation. In addition to sponsoring DFC25, a team from Mitsubishi Electric Corporation is contributing to the contest organization.
The Rules of the Game
- The dataset can be openly downloaded on the Zenodo platform.
Track 1: zenodo.org/records/14622048
Track 2: zenodo.org/records/14619798
- To enter the contest, participants must read and accept the Contest Terms and Conditions.
- For the sake of visual comparability of the results, all land cover maps shown in figures or illustrations should follow the color palette of the class tables below.
Land Cover Color Palette for Track 1
Building Damage Color Palette for Track 2
- The results should be submitted to the Codalab competition websites for evaluation.
- Ranking between the participants will be based on the metrics as described in the Submission and Evaluation Section.
- The maximum number of trials of one team for each track is ten in the test phase.
- The submission server of the test phase will be opened on March 2, 2025, at 23:59 UTC.
- The deadline for result submission is March 7, 2025, 23:59 UTC (e.g., March 7, 2025, 18:59 in New York City, March 8, 2025, 00:59 in Paris, or 07:59 in Beijing).
- Each team needs to submit a short paper of 1–2 pages by February 28, 2025, clarifying the used approach, the team members, their Codalab accounts, and one Codalab account to be used for the test phase. The paper must follow the IGARSS paper template and should be submitted via Microsoft Forms.
- For the winning teams, the internal deadline for full paper submission is April 18, 2025, 23:59 UTC (e.g., April 18, 2025, 19:59 in New York City, April 19, 2025, 01:59 in Paris, or 07:59 in Beijing). IGARSS Full paper submission deadline is May 15, 2025.
- Important: Only team members explicitly stated on these documents will be considered for the next steps of the DFC, i.e., being eligible to be awarded as winners and joining the author list of the respective potential publications (IGARSS25 and JSTARS articles). Furthermore, no overlap among teams is allowed, i.e., one person can only be a member of one team. Adding more team members after the end of the development phase, i.e., after submitting these documents is not possible.
- Persons directly involved in the organization of the contest, i.e., the (co-)chairs of IADF as well as the co-organizers are not allowed to enter the contest. Please note that IADF WG leads can enter the contest. They have been excluded from relevant information concerning the content of the DFC to ensure fair competition.
Failure to follow any of these rules will automatically make the submission invalid, resulting in the manuscript not being evaluated and disqualification from the prize award.
Participants in the Contest are requested not to submit an extended abstract to IGARSS 2025 by the corresponding conference deadline in January 2025. Only contest winners (participants corresponding to the eight best-ranking submissions) will submit a 4-page paper describing their approach to the Contest by April 18, 2025. The received manuscripts will be reviewed by the Award Committee of the Contest, and reviews sent to the winners. Winners will submit the 4-pages full paper to the Award Committee of the Contest by May 12, who will then take care of the submission to the IGARSS Data Fusion Contest Community Contributed Session by May 15, 2025, for inclusion in the IGARSS Technical Program and Proceedings.
For any questions, please contact the organizers at dfc25@googlegroups.com.
Acknowledgments
The IADF TC chairs would like to thank Capella Space, MAXAR, Umbra Space, the University of Tokyo, RIKEN, and ETH Zurich for providing the data, the IEEE GRSS for continuously supporting the annual Data Fusion Contest through funding and resources, and Mitsubishi Electric Corporation for sponsoring the winner team prize.


![]()