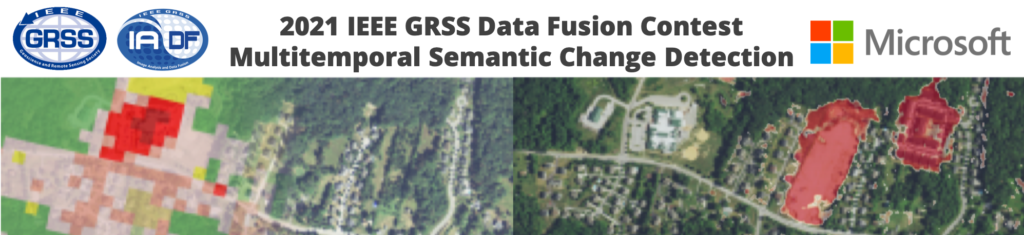
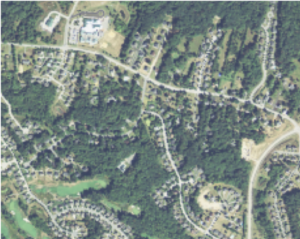
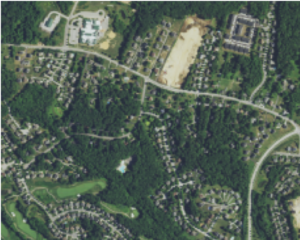
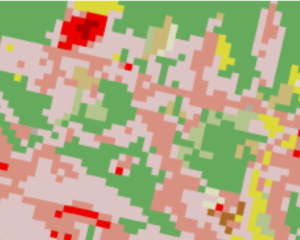
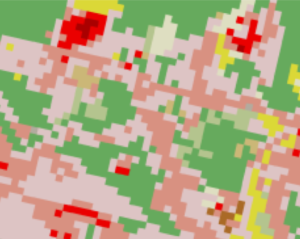
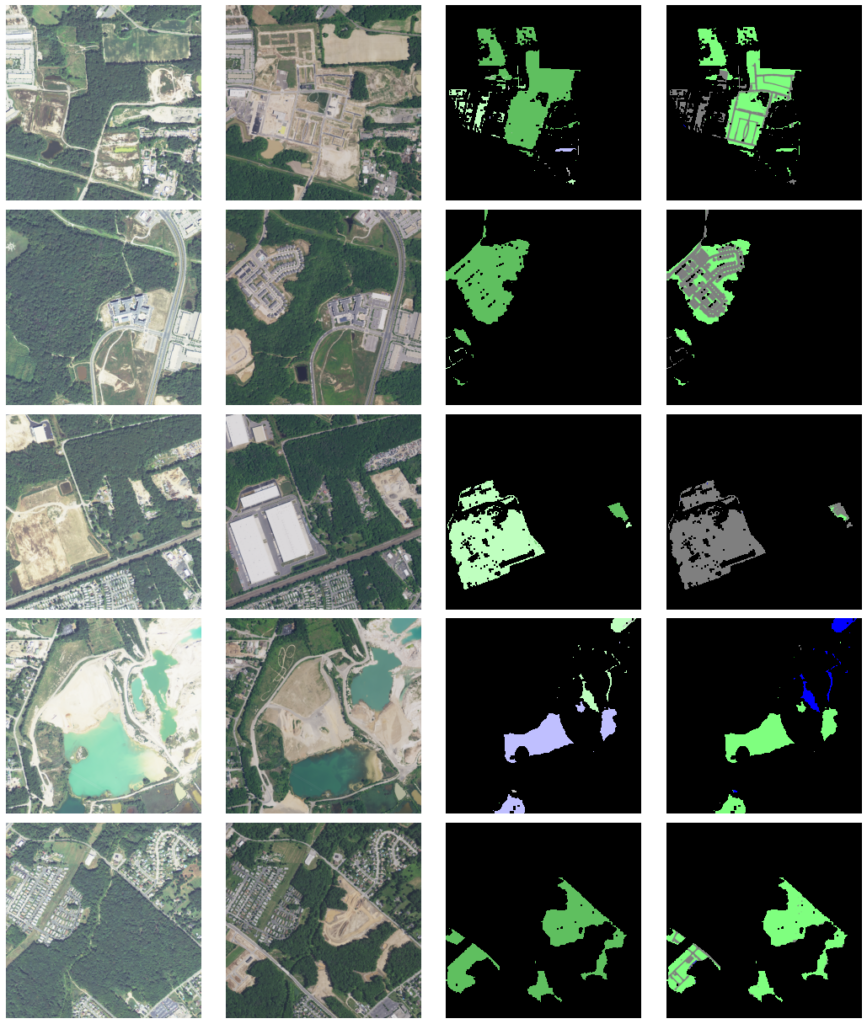
2021 IEEE GRSS Data Fusion Contest Track MSD

2021 IEEE GRSS Data Fusion Contest: Track MSD

Multitemporal Semantic Change Detection

The Challenge Track

he multitemporal semantic change detection challenge track (Track MSD) of the 2021 IEEE GRSS Data Fusion Contest, organized by the Image Analysis and Data Fusion Technical Committee (IADF TC) of the IEEE Geoscience and Remote Sensing Society (GRSS) and Microsoft Research and Microsoft AI for Earth, aims to promote research in automatic land cover change detection and classification from multitemporal, multiresolution, and multispectral imagery.

The task of Track MSD is to create bitemporal high resolution land cover maps using only low-resolution and noisy land cover labels for training. Such a scenario is often encountered around the world, as the proliferation of new sensors with either high spatial resolution (submeter) or high temporal resolution (weekly or even daily) remains unmatched by equally rich label data. Instead, detecting change would have to rely on the analysis of a sequence of input images in an unsupervised manner or with aid of weak, noisy, and outdated labels.

Participants will receive a dataset of 2250 tiles covering the US state of Maryland. For each tile, the following layers of data will be provided:

  • 1m multispectral aerial imagery for 2013
  • 1m multispectral aerial imagery for 2017
  • 30m multispectral satellite imagery for 5 points in time between 2013 and 2017
  • 30m noisy low-resolution land cover labels for 2013
  • 30m noisy low-resolution land cover labels for 2016

Participants will need to infer high-resolution land cover maps that identify changes between the 2013 and 2017 NAIP imagery for a subset of these 2250 tiles. The land cover change maps will be calculated between classes of a simplified scheme based on that of the noisy 30m low-resolution labels. The change maps will be scored on their accuracy in identifying areas with several particular kinds of change, described in the “Land cover change” section below.

The challenge is twofold: identifying what has changed between two high-resolution aerial images, and identifying what class of change it is based on weak labels.


Competition Phases

Track MSD aims to promote innovation in automatic land cover change detection and classification, as well as to provide objective and fair comparisons among methods. The ranking is based on quantitative accuracy parameters computed with respect to undisclosed test samples. Participants will be given a limited time to submit their land cover maps after the competition starts. The contest will consist of two phases:

  • Phase 1: Participants are provided with the entirety of the dataset to train their algorithms and a list of validation tile IDs (described below). Participants will submit land cover maps for the provided IDs on the CodaLab competition website to get feedback on the performance. The performance of the last submission from each account will be displayed on the leaderboard. In parallel, participants will submit a short description (1-2 pages) of the approach used to be eligible to enter Phase 2.
  • Phase 2: Participants will be provided with a separate set of test tile IDs and must submit their land cover change maps on CodaLab within five days. After evaluation of the results, four winners per each track are announced. Following this, they will have one month to write their manuscript that will be included in the IGARSS proceedings. Manuscripts are 4-page IEEE-style formatted. Each manuscript describes the addressed problem, the proposed method, and the experimental results.

Calendar

December 3rdContest opening: release of dataset
January 4thEvaluation server begins accepting submissions for validation dataset
February 28thShort description of the approach in 1-2 pages is sent to iadf_chairs@grss-ieee.org
March 8stRelease of test data; evaluation server begins accepting test submissions
March 12thEvaluation server stops accepting submissions
March 19thSource code is sent to iadf_chairs@grss-ieee.org for internal review.
March 26thWinner announcement

The Data

We provide the following open data layers over the state of Maryland, USA, split up into 2250 tiles (Figure 1). A tile is referenced by its index (an integer that ranges from 1 to 5386). Each tile covers approximately a 4km × 4km area (~4000 × 4000 pixels) and contains 9 data layers as described below. Each layer is provided as a separate GeoTIFF file in a compressed Cloud Optimized GeoTIFF format. The GeoTIFF file will be named in the format `{tile index}-{layer name}.tif`. The total size of the dataset on disk is 325GB. (See download instructions below.)

USDA National Agriculture Imagery Program (NAIP) data

This is multispectral aerial imagery (R, G, B, and NIR bands) collected at a 1-meter spatial resolution on single days in 2013 and 2017.

Landsat-8 (Landsat) data

This is 9-band multispectral satellite data at a 30m spatial resolution collected in 2013, 2014, 2015, 2016 and 2017. Each layer is a median composite of all Landsat 8 surface reflectance scenes that have first been masked with per pixel cloud and cloud shadow estimates (generated by the CFMASK algorithm) in the given year.

USGS National Land Cover Database (NLCD) data

This is 16-class land cover data at a 30m spatial resolution for 2013 and 2016 (from the April 2019 data release). This data is created by the USGS with a consistent methodology that allows change to be inferred between the different years of data.

Using other data sources

In the spirit of the data fusion contest, you are free to use other types of data sources as long as the data are available freely and, if geospatial data, broadly over space. For example, ImageNet pre-trained models are fine to use as they are not trained on labeled imagery in Maryland. OpenStreetMap data is also fine to use because such data is available outside Maryland, as well, allowing the solution to be applied broadly. However, using datasets that are specific to Maryland, USA, would preclude the widespread adoption of your proposed technique. This being said, we believe the change-detection task is solvable with the given datasets.

Land cover change

We are interested in identifying 8 types of high-resolution change between the two NAIP images (2013 and 2017):

  • Gain/loss of water
  • Gain/loss of tree canopy
  • Gain/loss of low vegetation
  • Gain/loss of impervious surfaces

The gain or loss of these four simplified land cover classes captures many interesting phenomena that will happen across the landscape and can inform a variety of conservation decisions. For instance, the overall gain in impervious surface is a surrogate for urban development over the time period. A loss of tree canopy and low vegetation immediately adjacent to rivers will represent a destruction of riparian buffers that will lead to increased levels of pollution running off into those rivers. Detecting high-resolution change from aerial imagery will reveal more about the processes that lead to these changes.

We intend for the provided coarse land cover labels (NLCD) to be used as weak supervision in training change detection models. We define a hard and soft mapping between the NLCD labels and the simplified land cover labels. We then describe how the change labels should be formatted and submitted on the CodaLab website.

The table below gives an approximate correspondence between the NLCD classes and the four simplified target labels. 30m blocks of pixels of a given NLCD class are likely to contain many pixels of the corresponding target class. However, note that the NLCD labels are noisy and should be treated only as a weak signal in making high-resolution predictions. For example, the “Developed, Open Space” and “Developed, Low Intensity” class often appears in cities and towns, in areas not densely covered by built surfaces such as roads and buildings, and consists mainly of high-resolution tree canopy and low vegetation pixels. We emphasize that this is simply one interpretation of the low-resolution labels and contestants should experiment with how to assign labels to areas where they have identified change.

Approximate class frequencies
NLCD class name Target class name Water TC LV Imperv.
11 Open Water Water 98% 2% 0% 0%
21 Developed, Open Space See note above 0% 39% 49% 12%
22 Developed, Low Intensity See note above 0% 31% 34% 35%
23 Developed, Medium Intensity Impervious 1% 13% 22% 64%
24 Developed High Intensity Impervious 0% 3% 7% 90%
31 Barren Land (Rock/Sand/Clay) Low Vegetation 5% 13% 43% 40%
41 Deciduous Forest Tree Canopy 0% 93% 5% 0%
42 Evergreen Forest Tree Canopy 0% 95% 4% 0%
43 Mixed Forest Tree Canopy 0% 92% 7% 0%
52 Shrub/Scrub Tree Canopy 0% 58% 38% 4%
71 Grassland/Herbaceous Low Vegetation 1% 23% 54% 22%
81 Pasture/Hay Low Vegetation 0% 12% 83% 3%
82 Cultivated Crops Low Vegetation 0% 5% 92% 1%
90 Woody Wetlands Tree Canopy 0% 94% 5% 0%
95 Emergent Herbaceous Wetlands Tree Canopy 8% 86% 5% 0%

Submission format

A single pixel that has experienced change will both “gain” a class in the 2017 data and “lose” a class in the 2013 data. As such, participants will submit predictions that amount to two independent land cover maps. Each pixel should be encoded by looking up its predicted 2013 land cover class and predicted 2017 land cover class in the table below. Pixels that do not change should be encoded with a 0 value. For example, a pixel that is Tree Canopy in 2013 and Impervious in 2017 would be encoded with the value 7.

 2017 Water2017 TC2017 LV2017 Imperv.
2013 Water0123
2013 Tree Canopy4067
2013 Low Vegetation89011
2013 Impervious1213140


The predictions for a particular tile should be encoded as a GeoTIFF with the Byte (uint8) data type and match the dimensions of the corresponding NAIP imagery. For example, tile id 546 has dimensions of 3880 × 3880; a set of land cover change predictions for this tile should have the same dimension and contain values between 0 and 14. Each tile of predictions should be compressed in place (e.g., using the GDAL library), or submitted in a compressed zip archive (versus an uncompressed zip archive). This is a particularly important point, as the competition website will not accept submissions of over 300MB and uncompressed submissions will likely surpass this limit. See the Baseline example code for examples of how to prepare a submission.

For evaluation of the predictions, for each of the 8 kinds of change (gain/loss of each of the 4 target classes), the paired land cover label predictions will be converted into a binary prediction mask (for example, Tree Canopy loss pixels are those predicted as class 4, 6, or 7). Participants will be scored on the intersection-over-union metric between this binary mask and the held out reference data for each of the 8 change types. The evaluation will be restricted to an undisclosed set of regions of interest within the tiles.

Finally, all figures during the competition should follow the specified color schemes. Change maps are to be visualized as a pair of images shown adjacent to each other: the loss map and the gain map, each in the respective color scheme shown below:

Class NameLoss ColorGain Color
Water    c0c0ff    0000ff
Tree Canopy    60c060    008000
Low Vegetation    c0ffc0    80ff80
Impervious    c0c0c0    808080

Baselines

Figure 1. The 2250 tiles covering the US state of Maryland. Participants will have full access to 9 data layers spanning 4 years across this area and will need to create high-resolution land cover change maps from coarse label supervision.


(a) NAIP 2013(b) NAIP 2017(c) NLCD 2013(d) NLCD 2016

Figure 2: Examples of 4 of the input layers in the MSD track of the DFC2021.

(a) NAIP 2013(b) NAIP 2017(c) Land cover loss(d) Land cover gain

Figure 3: Examples of NAIP 2013 and 2017 imagery and the desired output.

Results, Awards, and Prizes:

  • The first, second, third, and fourth-ranked teams in Track MSD will be declared as winners.
  • The authors of the winning submissions will:
    • Present their manuscripts in an invited session dedicated to the Contest at IGARSS 2021
    • Publish their manuscripts in the Proceedings of IGARSS 2021
    • Be awarded IEEE Certificates of Recognition
  • The first, second, and third-ranked teams in Track MSD will receive Azure credits of $10,000, $7,000, and $3,000 (USD), respectively, as a special prize.
  • The authors of the first and second-ranked teams in Track MSD will co-author a journal paper (in a limit of 3 co-authors per submission), which will summarize the outcome of the Contest and will be submitted with open access to IEEE JSTARS.
  • Top-ranked teams will be awarded during IGARSS 2021, Brussels, Belgium in July 2021. The costs for open-access publication will be supported by the GRSS. The winner team prize is kindly sponsored by Microsoft.

The rules of the game:

  • To enter the contest, participants must read and accept the Contest Terms and Conditions.
  • Participants of the contest are required to submit classification change maps in raster format as specified above.
  • For sake of visual comparability of the results, all classification maps shown in figures or illustrations should follow the color palette in the class table above.
  • The classification results will be submitted to the CodaLab competition website for evaluation.
  • Ranking between the participants will be based on the mean intersection-over-union (mIoU) averaged over these change classes.
  • The maximum number of trials of one team for each classification challenge is ten in the test phase.
  • Submission server will be open from March 8, 2021. Deadline of classification result submission is March 12, 2021, 23:59 UTC – 12 hours (e.g., March 12, 2021, 7:59 in New York City, 13:59 in Paris, or 19:59 in Beijing).
  • Each team needs to submit a short paper of 1–2 pages clarifying the used approach, the team members, their CodaLab accounts, and one CodaLab account to be used for the test phase by Feburary 28, 2021. Please send a paper to iadf_chairs@grss-ieee.org.
  • While open sourcing the used software is strongly encouraged, each team needs to submit its source code by March 19, 2021 for internal review only.
  • For the four winners, internal deadline for full paper submission is April 23, 2021, 23:59 UTC – 12 hours (e.g., April 23, 2021, 7:59 in New York City, 13:59 in Paris, or 19:59 in Beijing). IGARSS Full paper submission is June 1, 2021.
  • While submitting a classification result, each team will acknowledge that, should the result be among the winners, at least one team member will participate to the invited session at IGARSS 2021.

Failure to follow any of these rules will automatically make the submission invalid, resulting in the manuscript not being evaluated and disqualification from prize award.

Participants to the Contest are requested not to submit an extended abstract to IGARSS 2021 by the corresponding conference deadline in January 2021. Only contest winners (participants corresponding to the seven best-ranking submissions) will submit a 4-page paper describing their approach to the Contest by April 23, 2021. The received manuscripts will be reviewed by the Award Committee of the Contest, and reviews sent to the winners. Then winners will submit the final version of the 4 full-paper to IGARSS Data Fusion Contest Invited Session by June 1, 2021, for inclusion in the IGARSS Technical Program and Proceedings.

Acknowledgements

The IADF TC chairs would like to thank the IEEE GRSS for continuously supporting the annual Data Fusion Contest through funding and resources.

The winners of the competition will receive a total of $20k in Azure cloud credits as prizes, courtesy of Microsoft’s AI for Earth program.

Contest Terms and Conditions

The data are provided for the purpose of participation in the 2021 Data Fusion Contest. Participants acknowledge that they have read and agree to the following Contest Terms and Conditions:

  • In any scientific publication using the data, the data shall be referenced as follows: “[REF. NO.] 2021 IEEE GRSS Data Fusion Contest. Online: www.grss-ieee.org/community/technical-committees/data-fusion”.
  • Any scientific publication using the data shall include a section “Acknowledgement”. This section shall include the following sentence: “The authors would like to thank the IEEE GRSS Image Analysis and Data Fusion Technical Committee and Microsoft for organizing the Data Fusion Contest.