


Link to the labeling System: mapathon.geovisearth.com/explore
1. Introduction
Floods are the most prevalent and severe natural hazard and affect more people than any other environmental disaster. The report of Human Cost of Disasters issued by United Nations Office for Disaster Risk Reduction (UNDRR) reveals that there are 3,254 recorded flood events worldwide from 2000 to 2019, accounting for 44% of total disaster events. They affect 1.65 billion people, more than any other disaster type, of which 104,614 are fatal. Floods cause economic loss up to 651 billion US dollars. Unfortunately, flood frequency is likely to further increase in the coming years due to global climate change and urbanization.
Mapping flood vulnerable areas is fundamental to taking appropriate non-structural countermeasures (e.g., early warning and scheduling) and providing humanitarian assistance. Firstly, it benefits the analysis of triggering factors of past flood events and early warning of coming floods. The identified geographic areas become valuable data for statistical analysis and machine learning algorithms of flood forecast models. Secondly, it provides geospatial information and on-site inspections of flooded areas. This is significant for the evaluation of the damage extent and crucial for flood rescue in the context of destroyed transportation and communication facilities. Thirdly, it explores rural and less developed areas that are vulnerable to floods and have not yet received the full attention of the public.
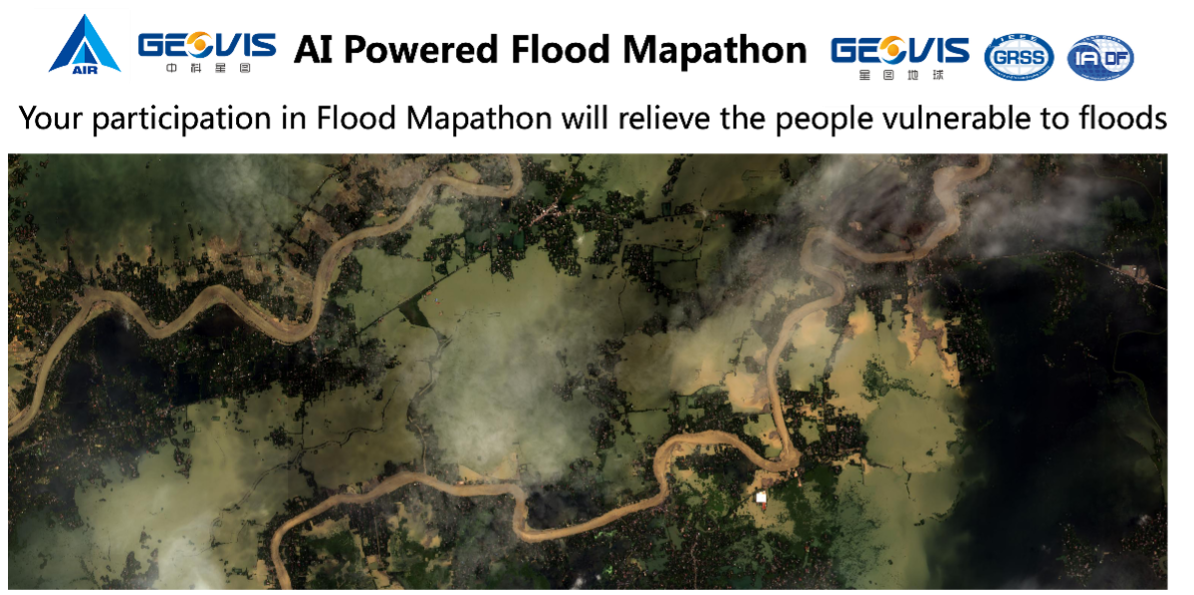
This Flood Mapathon aims to call people all over the world to contribute to completing a map of flood zones. The task focuses on mapping flood inundation areas and important ground features given satellite images. It supports manual mapping, automatic mapping using AI technologies, and their combinations.
2. Highlights
We actively explore the potential of advanced AI technologies to power flood mapping. Specifically, this event includes three highlights.
AI Powered
An AI program running in the background provides an initial mapping result. Participants can choose to continue mapping based on this preliminary result, to map flood inundation areas fully manually from scratch, or to map based on other participants’ results. The default AI results can be replaced by the submissions from alternative AI algorithms developed by participants. Further, the capacity of the default AI program is expected to evolve as the quantity and quality of annotations increase, which shows the power and fascination of artificial intelligence. In addition, participants can also use the functionality of SAM to intelligently segment maps and assist in improving annotation efficiency.
Visualize and Share
The participants can choose the image tiles they are interested in an online digital Earth. To increase user experience, it supports generating animations based on the mapping results, which can be freely shared on social media platform.
Open and Free
The data can be freely downloaded by the participants for usage in academic research. The participants are free to share their mapping results with other participants. Sharing is highly encouraged.
3. Task, Pipeline and Evaluation
Task
The Flood Mapathon focuses on mapping flood inundation areas and important features given high-resolution RGB satellite imagery for each flood vulnerable zone. Imagery of two timestamps before and during flood events will be provided. Specifically, important features include (0) background, (1) building, (2) road, (3) water, (4) barren, (5) forest, (6) agricultural.
To meet the needs of different types of participants, three mapping options are provided. The first is the manual mapping on the online labeling system from scratch. The second is automatic mapping using advanced AI technologies. The third is their combination.
Pipeline
To effectively map flood vulnerable areas in a collaborative way, a relay-style pipeline is designed. Specifically, it contains the following steps to finish the mapping:
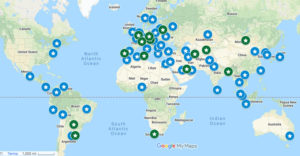
Step 1: Register and log into the Flood Mapathon online visualization subsystem (mapathon.geovisearth.com/explore), click on any satellite image tile that is not locked, and acquire the task. The system will automatically enter the labeling page.
Step 2: The participant who gets the first relay batons can choose to label manually from scratch, based on the results of default AI, or their own algorithm. Participants who get any subsequent relay batons can only continue labeling manually based on the previous results or using the SAM segmentation function.
Step 3: The participant releases the relay baton after the annotation is completed to label other tiles. Now, other participants can acquire that relay baton to continue labeling.
A video tutorial can be seen in Youtube.
Evaluation
To evaluate the labeling quality, we use the popular mIoU metric (which is widely used in semantic segmentation) for evaluation. Since collaboration is highly encouraged in this activity, the contributions of the participants are computed according to the improvements instead of the submitted status. The final score is accumulated on all the tiles.
4. Schedule
- Opening: October 16, 2023
- Mapping: October 16, 2023 – January 15, 2024
- Closing: January 15, 2024
- Winner Announcement: by January 30, 2024
5. Data
Table I: Satellite images of flood events
No. | Time Stamp | Sensor | Satellite | GSD | City | Country |
1 | 2022-08-24 (during flood) | DLC | GAOFEN-7 | 0.8m | Boghe | Mauritania |
2019-05-30 (before flood) | PM2 | GAOFEN-2 | 0.8m | Boghe | Mauritania | |
2 | 2022-08-24 (during flood) | DLC | GAOFEN-7 | 0.8m | Gamadji Sarre | Senegal |
2019-05-30 (before flood) | PM2 | GAOFEN-2 | 0.8m | Thille Boubakar | Senegal | |
3 | 2022-07-05 (during flood) | PM2 | GAOFEN-2 | 0.8m | Deulgram | Bangladesh |
2022-11-20 (after flood) | PM2 | GAOFEN-2 | 0.8m | Deulgram | Bangladesh | |
4 | 2022-07-10 (during flood) | PM1 | GAOFEN-2 | 0.8m | Barasakua | Bangladesh |
2021-01-09 (before flood) | PM2 | GAOFEN-2 | 0.8m | Fatehpur | Bangladesh | |
5 | 2022-10-17 (during flood) | GLC | GAOFEN-7 | 0.8m | Agenebode | Nigeria |
2018-11-09 (before flood) | PM1 | GAOFEN-2 | 0.8m | Ajaka I | Nigeria | |
6 | 2022-10-08 (during flood) | GLC | GAOFEN-7 | 0.8m | Karim “B” | Nigeria |
2021-02-28) (before flood) | PM1 | GAOFEN-2 | 0.8m | Karim “B” | Nigeria | |
7 | 2022-08-28 (during flood) | PM1 | GAOFEN-2 | 0.8m | Ghotki | Pakistan |
2019-06-17 (before flood) | PM2 | GAOFEN-2 | 0.8m | Ghotki | Pakistan | |
8 | 2022-06-21 (during flood) | PM2 | GAOFEN-2 | 0.8m | Huangshi | China |
2020-05-03 (before flood) | PM2 | GAOFEN-2 | 0.8m | Huangshi | China |
6. Rewards
You will receive a certificate from IEEE GRSS to honor your considerable contributions to mapping flood vulnerable areas. We highly appreciate your efforts which are important to the numerous people impacted by floods. In addition to a certificate, you will receive one of the following gifts, courtesy by Geovis Technology Co.,Ltd.
Table II: Rewards
Winners | Reward | picture |
Rank 1 to 15 | Astronomical telescope |  |
Rank 16 to 50 | AI Bluetooth Speaker with Sand Art |  |
Rank 51 to100 | DIY Luminous Tellurion |  |
Rank 101 to 200 | Pen Container |  |
7. Acknowledgments
This flood mapathon event is collaboratively organized by Aerospace Information Research Institute under Chinese Academy of Sciences (AIRCAS), Geovis Technology Co.,Ltd (Geovis), Geovis Earth Technology Co., Ltd (Geovis Earth)., IEEE GRSS IADF. We acknowledge the contributions of these organizations in terms of the custom software development, the computation resources, the online digital Earth, the RingMo AI tools, the online labeling tool, and the rewards. We appreciate the technical supervision from IEEE GRSS and IEEE GRSS IADF.