


NASA VEDA ARTICLE 1
written by Madeleine Dawson
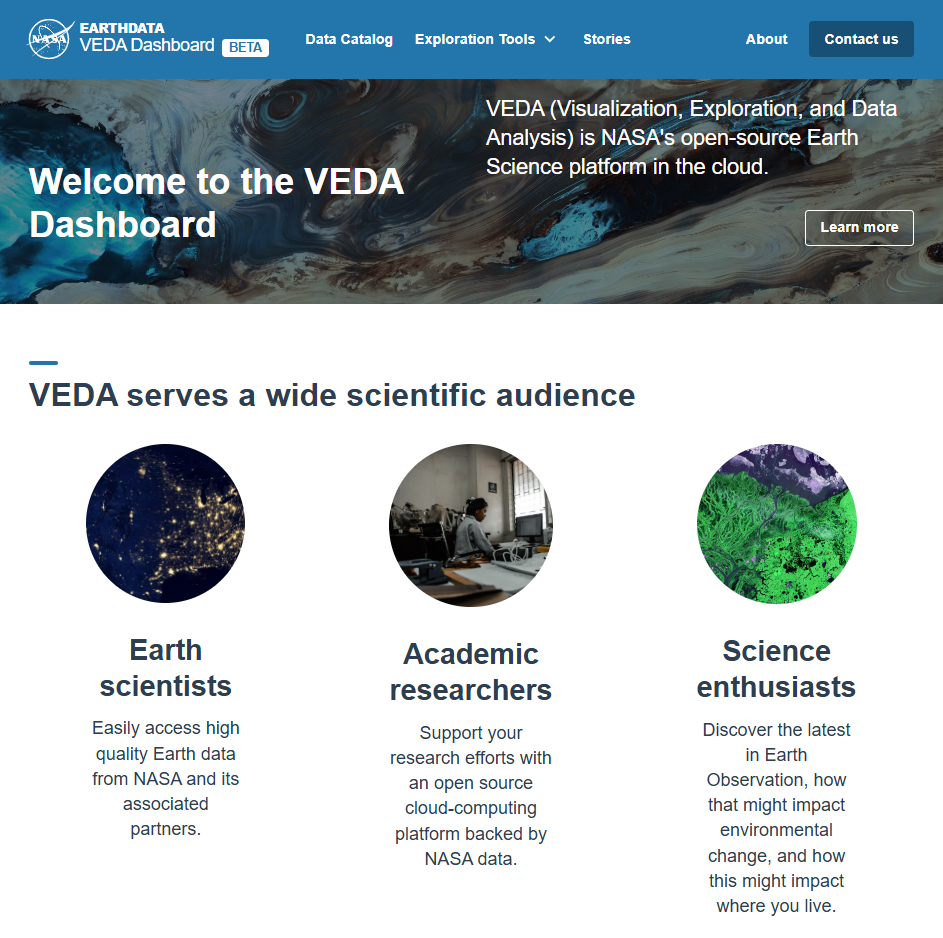
www.earthdata.nasa.gov/dashboard
NASA’s VEDA Dashboard and its impact within GRSS
The volume of Earth Observation data available has never been greater, yet our ability to fully leverage it has not kept pace. Across research, nonprofit, and commercial sectors, geospatial users continue to face barriers in data access, integration, and streamlined analysis. This contributes to a growing gap between the data we have and the insights society needs. NASA’s Visualization, Exploration, and Data Analysis (VEDA) platform is designed to help close that gap.
“Our archive grows faster than our community’s ability to navigate it. A researcher looking for the right data for their science question may spend considerable time identifying the right datasets, understanding their quality and coverage, and getting them into a usable form. That time is not science. It is friction between our data and the scientific return.” – from NASA Earth Data www.earthdata.nasa.gov/about/ai-strategy
GRSS recently spoke with Dr. Freitag and a student-led team from the University of Alabama in Huntsville (UAH) to learn more about the VEDA platform, its contributions to the earth-observing community, and how GRSS, and other communities, can benefit from its open and modular ecosystem. Dr. Freitag, who leads the Data Systems Evolution team within the Office of Data Science and Informatics (ODSI) at NASA Marshall Space Flight Center, discussed the origins of VEDA, an open-source, cloud-based geospatial visualization and analysis dashboard designed to improve accessibility to Earth observation data and accelerate collaborative scientific workflows. He also highlighted the newly deployed GRSS instance of VEDA and its role in supporting the remote sensing community through expanded access to scalable, interactive geospatial tools.
Origins and curation of NASA’s VEDA dashboard: From pandemic tracking applications to storytelling dashboard
Dr. Freitag became involved with the project through his passion for visualization and improving accessibility to Earth science data, particularly for early-career researchers. He has led the NASA VEDA effort for the past three years and has witnessed its evolution from an initially piecemeal effort into a broader cloud-based science platform. The foundation of VEDA began through the Multi-Mission Algorithm and Analysis Project (MAAP), a collaboration with ESA to support joint algorithm development and interoperable data systems in the cloud. During the COVID-19 pandemic in 2020, the team rapidly expanded the project to produce a visualization interface for assessing the impacts of the pandemic on air quality and populations. As development progressed, the team recognized the potential to extend these capabilities far beyond a single dashboard, supporting broader scientific analyses and visualization across the Earth science community. From there, the storytelling component naturally evolved into what is now featured on the platform through its interactive data stories.
“[VEDA] gives you the opportunity to describe why [your newly published data product] is valuable through data-driven storytelling,” states Andrew Blackford, an atmospheric science PhD student at the University of Alabama in Huntsville’s (UAH). Andrew, who used VEDA in developing his Master’s thesis, has been a VEDA user for several years, contributing data stories, and using the Exploration environment regularly to analyze the dozens of curated datasets available in the platform.
What needs does VEDA address in the EO community?
Bringing the compute next to the data in the cloud, optimizing workflows, and reducing barriers to entry for users
A major challenge the VEDA platform aims to address is the disconnect between cloud-hosted datasets and traditional scientific workflows that depend on local laptops or computing clusters. Conventional processing often requires the user to download massive amounts of data locally, limiting analysis by bandwidth, storage capacity, and available computing resources. Through cloud-based JupyterHub environments, VEDA instead brings computation directly to the data, enabling more scalable analysis while reducing time from data discovery to scientific output in the Earth observation community.
In addition to providing access to data at scale, VEDA emphasizes the importance of accessible algorithms, optimized code, and interactive visualization tools. Dr. Freitag explained that simply moving datasets to the cloud is not sufficient if researchers continue relying on traditional processing approaches that operate on entire files sequentially, resulting in significant runtime and computational costs. Instead, cloud-based analyses require more targeted data access methods to optimize data processing in scalable computing environments. The platform also incorporates lightweight visualization interfaces that allow users to quickly explore datasets, perform basic analyses, and assess whether the data are appropriate for their application before committing to more computationally intensive workflows.
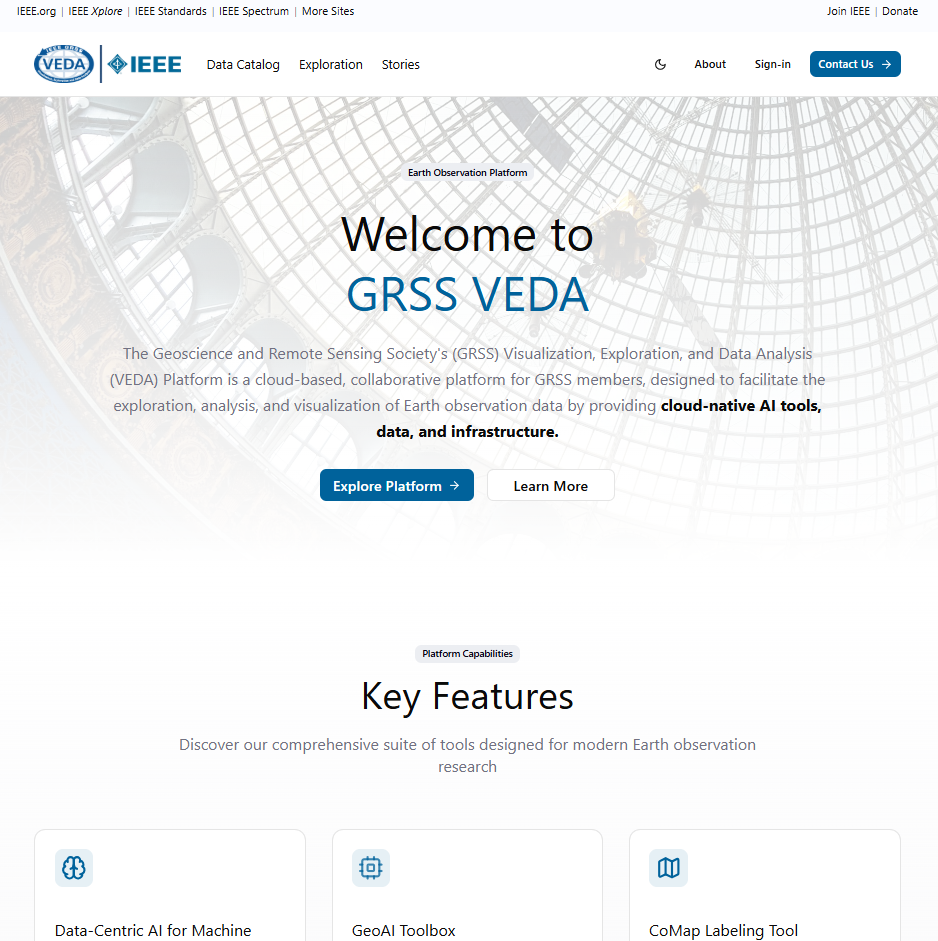
What is GRSS-VEDA and what does it provide?
The GRSS-VEDA instance of the platform takes advantage of the modular nature of VEDA by integrating its core components including the data catalog, data services, compute resources, dashboard, and the storytelling. Together these tools provide researchers with an interactive environment for exploring, analyzing, and communicating Earth observation data products.
As NASA works across the Geoscience and Remote Sensing (GRSS) community, the team identified a valuable opportunity to support early career scientists developing these leading-edge geospatial data products. Rather than relying on static figures generated from Python scripts, researchers can use the platform to create interactive data stories for project proposals or showcase prototype data products in a more dynamic and accessible format throughout the investigative process!
VEDA was also created using community-backed open standards, allowing users to confidently integrate datasets and services across multiple applications. For example, VEDA services can provide endpoints compatible with tools such as ArcGIS to meet the user where they are. A standardized metadata schema is used to allow the usage of data from multiple sources seamlessly and promotes the comparison between authoritative datasets provided by NASA, ESA, NOAA, and USGS. Additionally, the platform allows users to bring their own data to the data catalog, allowing direct comparison with established products to assess performance and scientific validity.
As Dr. Freitag noted, “It is hard to get started sometimes, so anywhere you can allow those early career users to be seen as community leaders earlier in their career, it enables them to be successful down the road.” The GRSS-VEDA instance aims to support early career researchers, GRSS schools, workshops, and learning events, and provide a platform for GRSS members to collaborate and engage with earth observing datasets.
“VEDA is a great opportunity to get introduced to understanding how to use datasets and what they mean,” writes Ethan Ker, Graduate meteorology student from UAH, contributing to GRSS VEDA data stories. “In order to tell a story with [these datasets], solid knowledge is required on how they work. VEDA can increase exposure to how data can be used in creative manners to tell stories in various scientific fields.”
Andrew Blackford, Ethan Ker, Aaron Serre, McKenzie Hicks, and Sam Bailey make up the small, student-driven team from the University of Alabama in Huntsville who have been working with GRSS VEDA to publish one of its first data stories. Their story focuses on examining the impact of artisanal and small-scale gold mining in several South American and African countries. You can read this GRSS VEDA Data Story here.
“The attribution students get from collaborating on data stories helps build their repertoire going into their early careers, and also gives them unique insight into working with government agencies and their partners that not very many graduate programs are blessed to have access to,” Andrew Blackford mentions.
Why is this significant for the GRSS community?
Dr. Freitag emphasized that many Earth observation datasets are still not fully cloud optimized, or easily integrated into scalable scientific applications. Products such as MODIS were not originally designed for modern cloud-native computing environments, creating barriers for researchers attempting to rapidly develop and deploy new scientific products. Efforts such as GRSS-VEDA represent an important step towards more streamlined and accessible infrastructures within IEEE GRSS.
A major focus moving forward is the continued development of open-source resources alongside a movement towards a broader collaborative user community through NASA’s Open Source Science Initiative (OSSI). Dr. Freitag concluded, “We want the community to adopt the available products, but need to lead them on their journey a bit. Get them started and get their feet wet…let them dive in rather than leaving them on the edge without letting them know what the murky water has in it.” We encourage readers to explore the NASA-GRSS instance of VEDA and learn more about the platform and its growing community resources.
How can I get involved?
Currently, GRSS-VEDA has a beta user feedback system in place for those early adopters and users of this instance of the platform. You can get involved by becoming a part of this emerging community through the link below. Your feedback will aid in advancing VEDA’s baseline architecture, and can then be potentially used in deployment for other communities. Overall, your participation can inform the development of the core infrastructure and lead this initiative into the future of remote sensing applications!
Apply to participate in the GRSS VEDA Beta User Program! Applications close July 10th, 2026.
![]()